✨ TrendSense: AI-Powered Stock Prediction
🚀 The Big Picture
Welcome to TrendSense — my final capstone project that blends AI, financial modeling, and real-time data visualization. Below is the full dashboard suite, designed to give investors a daily, weekly, and monthly view of the stock market using a proprietary scoring system powered by sentiment analysis and statistical forecasting.
You can think of this dashboard as a daily command center: blending market sentiment, analyst ratings, and financial health into one centralized place to inform smarter trading decisions.
Want to dig into how each part works?
Scroll down 👇 for a deeper look at each page!
TrendSense is an AI-powered stock market prediction system that combines financial data, sentiment analysis, and machine learning to help investors make informed, data-driven decisions. The project was created to address a key problem with investing: the difficulty of filtering through financial news, analyst ratings, and stock movements to make objective trading decisions.
Stock prices are influenced by a combination of market sentiment, financial performance, and external macroeconomic factors, yet many investors rely on emotion-driven speculation rather than data-backed insights. TrendSense was designed to remove emotional bias by aggregating financial indicators, AI-generated sentiment scores, and predictive modeling into a single ranking system—the TS Score.
At the heart of TrendSense is a multiple regression model that predicts next-day price movements based on historical stock performance, AI-driven news sentiment, analyst ratings, and broader market trends. Additionally, the TS Score is calculated using a weighted combination of AI sentiment analysis, financial health metrics, and market sentiment, helping investors identify top-performing stocks for both short-term trades and long-term investments.
This system is fully automated and dynamic, with a Google Cloud-powered data pipeline that retrieves stock data in real-time, processes AI sentiment analysis using OpenAI’s language models, and updates predictions daily. The insights are presented in interactive Power BI dashboards, allowing users to explore daily, weekly, and year-to-date stock performance, sector-wide trends, and analyst ratings.
While TrendSense cannot eliminate market uncertainty, it provides a structured, data-driven framework for evaluating stock opportunities, ensuring that investment decisions are based on quantifiable insights rather than speculation. By continuing to refine its predictive algorithms, expanding data sources, and optimizing AI processing, TrendSense aims to become a leading tool in AI-powered stock analysis, empowering investors with clear, actionable insights for navigating market fluctuations.
1️⃣ Daily Dashboard – Real-Time Stock Performance & Predictions
📊 How It Works:
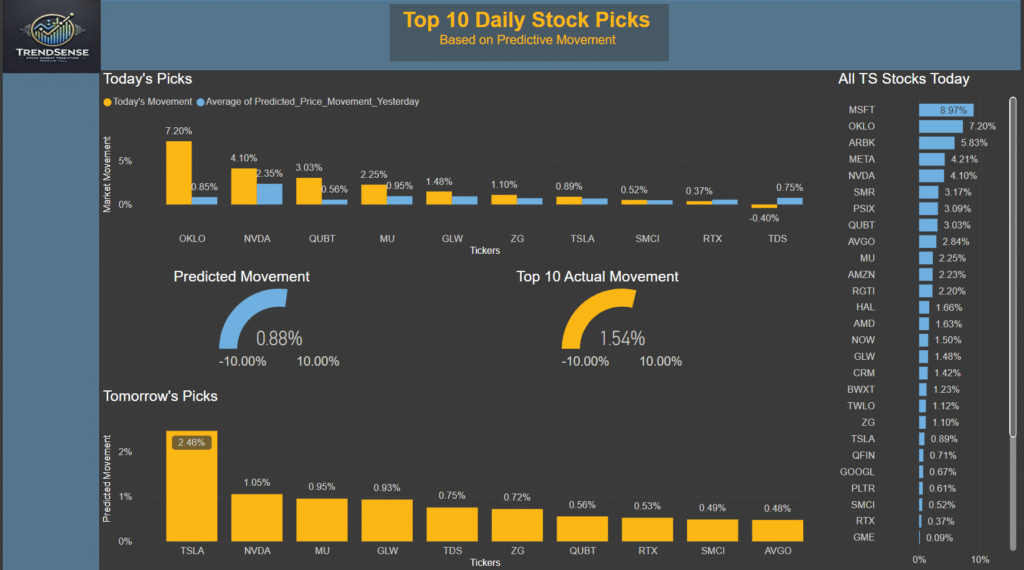
The Daily Dashboard provides a real-time comparison of TrendSense’s stock movement predictions versus actual market performance. The top section highlights today’s predicted vs. actual movement, allowing users to evaluate the accuracy of the model.
The Tomorrow’s Picks section ranks stocks expected to have the highest movement in the next trading day based on AI-driven sentiment analysis, financial health scores, and regression modeling. Investors can use this dashboard to track daily trends, refine their short-term trading strategies, and validate the predictive model’s performance.
2️⃣ Weekly Dashboard – Tracking Market Trends Over Time
💡 Let’s zoom out. This dashboard tracks short-term momentum over the course of a week, helping identify which stocks are consistently performing — or losing steam.
📊 How It Works:
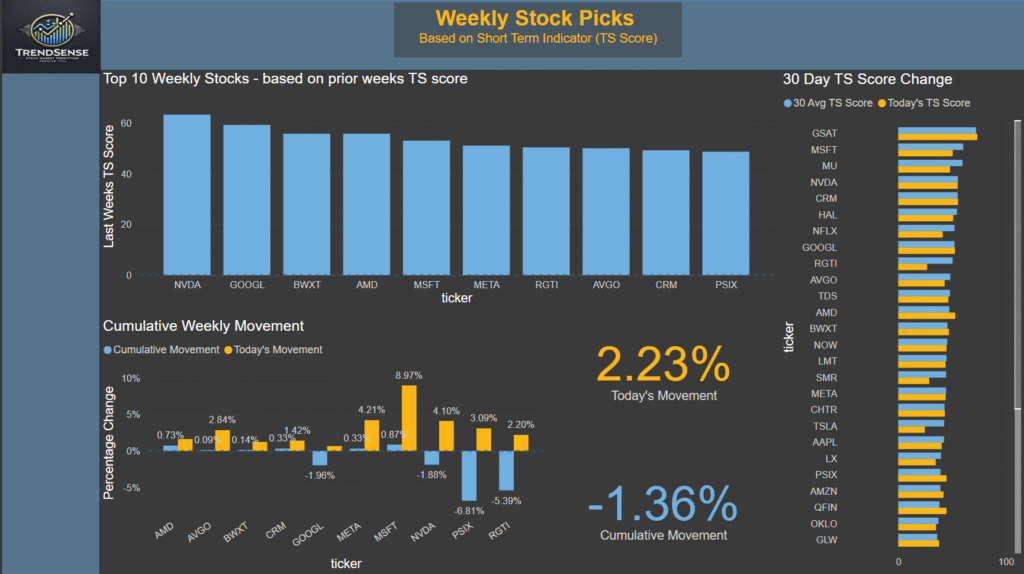
The Weekly Dashboard helps investors analyze cumulative stock performance over the past week to spot momentum trends and sector-wide movements. The Top 10 Weekly Stocks section highlights the best-performing stocks based on weekly TS Score rankings, while the Cumulative Weekly Movement graph compares today’s price movement with the past week’s trends.
By tracking 30-day TS Score changes, this dashboard allows users to see whether a stock is gaining or losing strength over time, helping traders and long-term investors identify potential opportunities before the market reacts.
3️⃣ Year-to-Date (YTD) Performance Dashboard – Comparing TrendSense to the Market
💡 Here’s the big-picture performance check. This view shows how TrendSense’s picks are doing over time compared to the S&P 500 and our broader stock universe.
📊 How It Works:
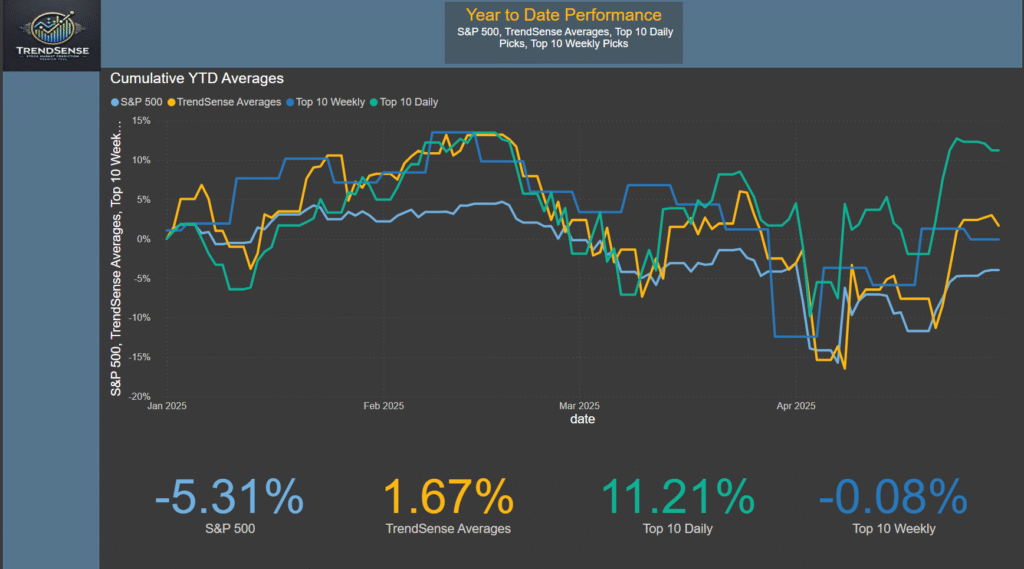
The YTD Performance Dashboard tracks how TrendSense’s stock picks compare to the overall market, specifically against the S&P 500 benchmark. The line chart shows how different stock groups—TrendSense’s tracked stocks, top daily picks, and top weekly picks—have performed cumulatively throughout the year.
This dashboard is useful for investors who want to assess TrendSense’s predictive accuracy over time, analyze which categories of stocks have performed best, and compare investment strategies against broader market trends.
4️⃣ Predicted vs. Actual Stock Movement – Model Accuracy Over Time
💡 How well does TrendSense actually predict the market? This page compares predicted daily stock movements with what actually happened — one day at a time.
📊 How It Works:
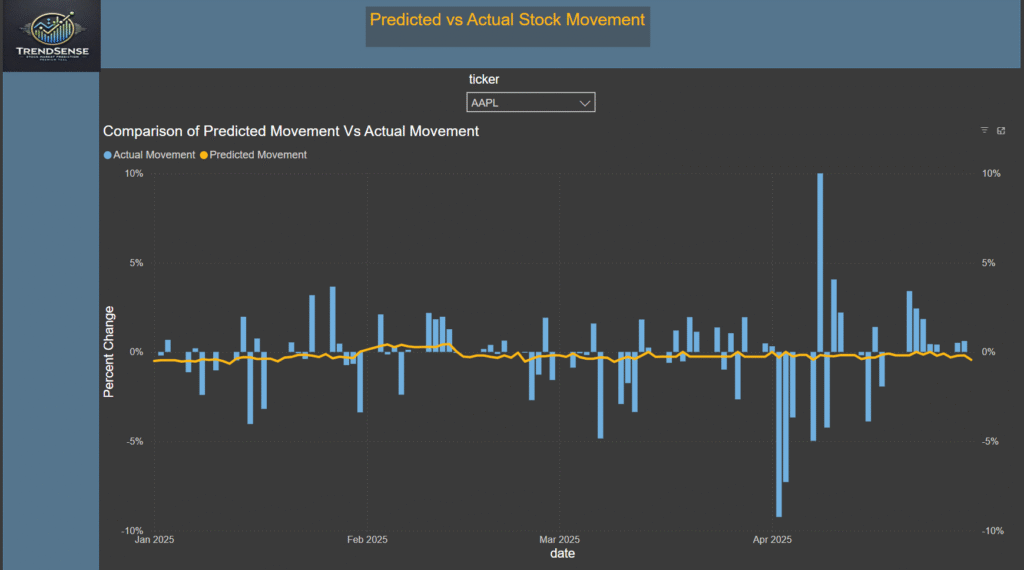
This dashboard tracks how the model’s daily forecasts stack up against actual market performance. The line graph shows Predicted vs. Actual Movement over time, helping assess the overall accuracy and consistency of the TrendSense system.
Each point on the graph represents an average across all tracked stocks for that day, providing a high-level view of how well the regression models are aligning with market outcomes.
This page is key for validating model reliability. A close alignment between the two lines indicates the predictive engine is performing well, while divergence helps highlight opportunities to refine coefficients, input weights, or factor sensitivity. It turns raw forecasting into measurable, visual accountability.
5️⃣ News & Sentiment Breakdown – AI in the Headlines
💡 This is where AI meets the news. TrendSense reads the day’s financial headlines and turns them into actionable sentiment scores tied to specific tickers.
📊 How It Works:
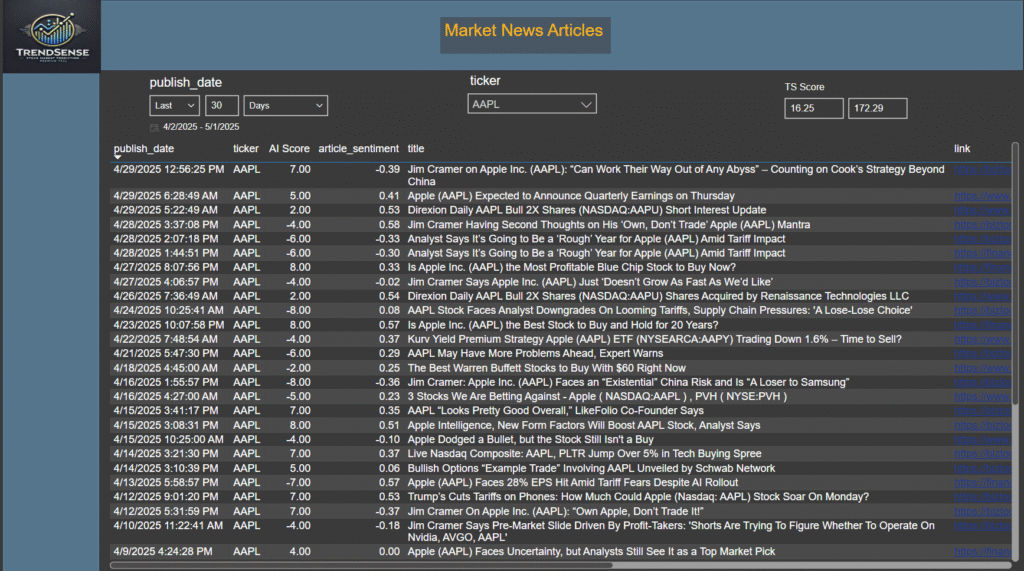
This page gives a real-time look into how news sentiment is processed and scored. Each row shows a news article about a tracked stock, the AI-generated sentiment score (from OpenAI’s GPT model), and the VADER sentiment score calculated from the article’s summary text.
The AI prompt used asks the model to rate each headline’s impact on a specific stock, returning a single number from -10 to +10. This score feeds directly into the regression model and TS Score.
You can click the news links to read the original article and see how AI interpreted its tone. This dashboard demonstrates how TrendSense transforms qualitative market headlines into quantitative signals, bringing clarity to a noisy financial landscape.
6️⃣ TS Score Component Analysis – Understanding Stock Movement Drivers
💡 Ever wonder what’s really driving price movement? This dashboard breaks down how each part of the TS Score performs on its own.
📊 How It Works:
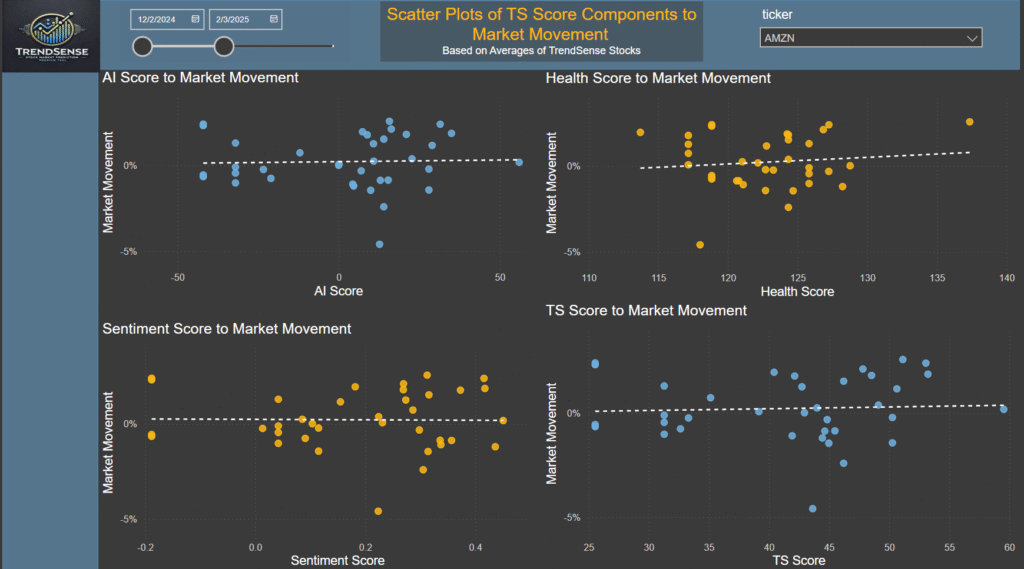
This dashboard visualizes the relationship between each core component of the TS Score—AI Sentiment, Market Sentiment, and Financial Health—and actual stock price movement. By displaying each component as a scatter plot, investors can assess which signals have the strongest correlation with short-term performance.
For example, if the AI Sentiment Score vs. Market Movement plot shows a consistent upward trend, it suggests that headline-driven sentiment is a key driver of that stock’s price behavior. A scattered pattern in the Health Score plot may imply that fundamentals play a longer-term role, but aren’t as predictive day-to-day.
These plots help validate the weighting of each score within the TrendSense model, giving users more transparency and the opportunity to adjust their strategies based on real-world data patterns.
7️⃣ Monthly Picks – Identifying Consistent Leaders
💡 Which stocks are quietly climbing all month long? This dashboard highlights the movers that are building momentum over time—not just day-to-day.
📊 How It Works:
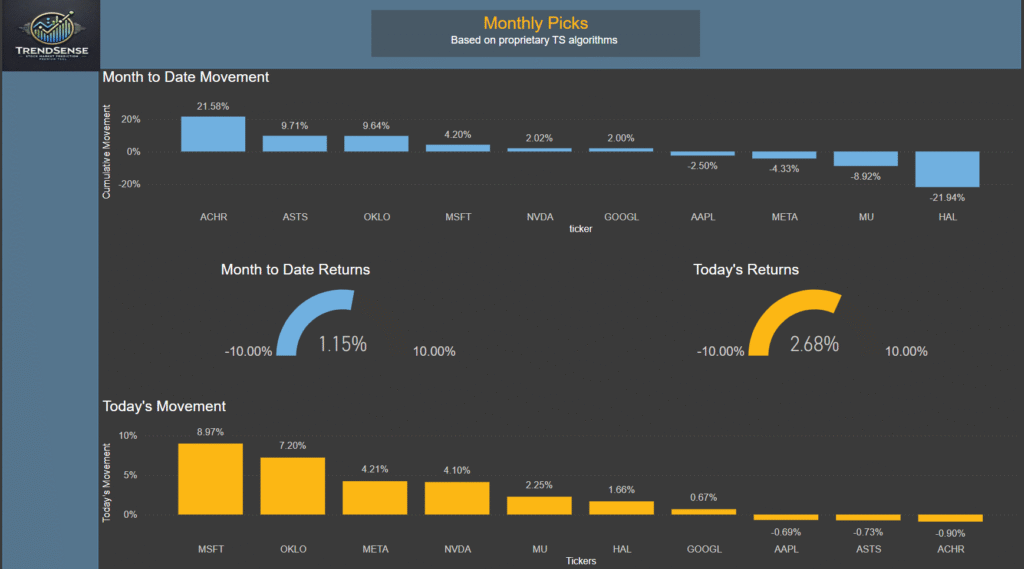
The Monthly Picks dashboard focuses on month-to-date (MTD) performance to identify stocks with consistent strength—or weakness—over a longer horizon. It’s designed to help investors look beyond daily volatility and recognize sustained movement trends that may signal long-term potential.
The Cumulative Movement chart shows how much each stock has gained or lost throughout the current month, offering a view of broader momentum. Meanwhile, the Today’s Movement chart shows how those trends are evolving in real time, helping investors confirm or question whether a stock’s trend is still intact.
This dashboard is particularly useful for swing traders and position holders looking to spot breakout candidates or assess whether recent gains are part of a true uptrend or just short-term noise.
8️⃣ TrendSense Component Breakdown – How the System Works
💡 What exactly powers TrendSense? This page breaks down each component behind the scenes—from scoring systems to predictions—to show how it all comes together.
📊 How It Works:
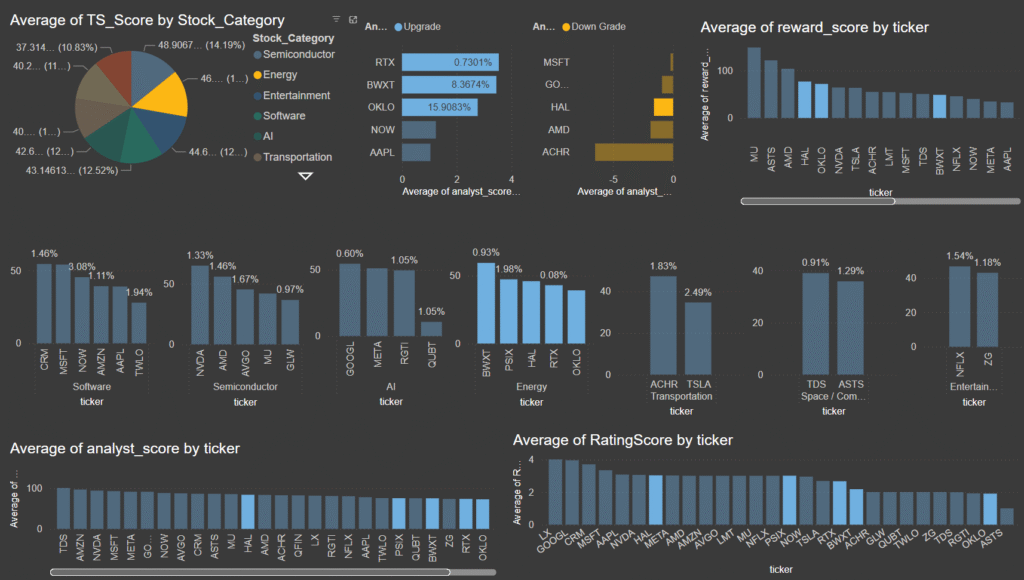
TrendSense is built on a multi-layered system that transforms raw financial data, news sentiment, and analyst insights into actionable stock predictions. This dashboard offers a detailed breakdown of the individual components that power the platform.
Here’s what it includes:
-
TS Score – The core ranking metric, calculated as the average of the AI Sentiment Score, Market Sentiment Score, and Financial Health Score.
-
AI Score – A value between -10 and 10 generated by GPT models, representing how financial news headlines are expected to impact a specific stock.
-
Sentiment Score – Derived using the VADER sentiment package in Python, this score evaluates the tone of article summaries and reflects the broader mood around a stock.
-
Health Score – Built from financial ratios, analyst ratings, target price changes, and earnings growth to measure a stock’s fundamental strength.
-
Predicted Price Movement – Using daily retrained regression models, TrendSense forecasts each stock’s next-day movement based on these three input scores.
This page also includes ranking metrics like TS Rank, Composite Rank, and TS Score Change, which help identify the top 10 stocks daily and weekly. These layered metrics allow TrendSense to adapt in real time and help investors sort through dozens of tickers to find high-confidence picks.
Together, these components create a system that balances short-term momentum with long-term stability—designed to help users make smarter, data-driven investment decisions every day.
Key Factors in TrendSense and Why They Matter
The TrendSense predictive model is built on a foundation of quantitative financial data, AI-driven sentiment analysis, and market-wide performance indicators. These factors are carefully selected to create a balanced and dynamic stock ranking system, ensuring that investors receive data-backed insights rather than speculative or emotionally driven decisions.
Each factor plays a distinct role in determining short-term price movements and long-term stock strength. Below is a breakdown of the key metrics collected in the TrendSense model and why they are crucial for stock analysis.
1️⃣ AI Sentiment Score – Measuring Market Perception
🔍 What it Measures:
The AI Sentiment Score quantifies how financial news and market discussions impact a stock’s short-term movement. Using OpenAI’s language models, TrendSense scans headlines and assigns a score from -10 (strongly negative) to +10 (strongly positive) based on how the news is likely to influence investor sentiment.
📈 Why it Matters:
Market sentiment can often drive short-term volatility, even when fundamentals remain unchanged. Stocks can rise or fall based on breaking news, earnings reports, regulatory decisions, or social media hype. The AI Sentiment Score helps investors determine whether a stock is moving due to genuine strength or simply short-term market reaction.
2️⃣ Market Sentiment Score – Evaluating Sector-Wide Trends
🔍 What it Measures:
The Market Sentiment Score assesses how a stock is performing relative to its industry and broader market conditions. This score factors in:
- The stock’s daily and weekly movement compared to its sector average
- Sentiment trends affecting competing companies
- Broader economic trends impacting multiple stocks in the same category
📈 Why it Matters:
Stock performance is not isolated—it is often influenced by sector-wide movements and macroeconomic conditions. For example, if NVIDIA releases a breakthrough AI chip, semiconductor stocks like AMD and Intel may also react. Understanding sector sentiment ensures that investors are not only looking at individual stocks but also recognizing industry-wide momentum that could influence performance.
3️⃣ Financial Health Score – Evaluating Long-Term Stability
🔍 What it Measures:
The Financial Health Score evaluates a stock’s fundamental strength, using key financial indicators such as:
- Earnings Growth Rate – Determines whether the company is growing profitably
- Debt-to-Equity Ratio – Measures how much debt the company is carrying relative to its equity
- Analyst Ratings & Price Targets – Shows how financial experts view the company’s long-term potential
📈 Why it Matters:
While sentiment and market trends drive short-term price movements, strong financial fundamentals determine whether a stock can sustain growth over the long term. A company with high earnings growth, low debt, and strong analyst ratings is more likely to perform well even in volatile market conditions.
4️⃣ TS Score – Combining Key Factors into One Predictive Metric
🔍 What it Measures:
The TrendSense Score (TS Score) is the final ranking system that combines:
- AI Sentiment Score (short-term influence of news and headlines)
- Market Sentiment Score (sector-wide trends and momentum)
- Financial Health Score (long-term stability and fundamental strength)
Each score is weighted dynamically based on its statistical impact on stock movements. The TS Score allows for direct stock comparisons, ranking stocks based on their combined market strength, financial health, and sentiment analysis.
📈 Why it Matters:
The TS Score provides a single, easy-to-interpret number, helping investors quickly identify the strongest stocks for the next day, week, or month. Instead of trying to manually balance dozens of data points, investors can rely on the TS Score to highlight the best opportunities based on real-world market trends.
5️⃣ Daily, Weekly, and Yearly Performance Tracking – The Bigger Picture
🔍 What it Measures:
- Daily Trends: Tracks short-term stock movements based on predicted vs. actual performance.
- Weekly Insights: Evaluates how stocks are performing over a longer timeframe, ensuring that short-term fluctuations do not mislead investors.
- Year-to-Date Analysis: Compares TrendSense’s top picks with the broader S&P 500 index, helping users see how well the model performs over time.
📈 Why it Matters:
Short-term movements do not always indicate long-term success. By tracking performance over different time horizons, TrendSense helps investors avoid overreacting to temporary stock movements and instead focus on consistent trends and strong investment opportunities.
Conclusion – A Smarter Approach to Stock Prediction
By integrating AI-driven sentiment analysis, market-wide trends, and financial fundamentals, TrendSense provides a holistic view of stock performance. Instead of relying on emotion or speculation, investors can use these data-backed insights to make confident, strategic investment decisions.